Highest rental yields in Europe 2026: areas ranked
Estimate · Estimated gross rental yield, GableIndex calculation from official rent and sale-price statistics; before costs, taxes and vacancy.
Across 645 areas in Portugal, Ireland, England & Wales and Spain, the highest estimated gross rental yield in our data is 12.35% in Vila Nova de Paiva (Portugal). Median by market: Spain 5.78%; Ireland 5.24%; Portugal 5.15%; England & Wales 4.36%. Each figure is annual rent ÷ price from official statistics, before costs, taxes and vacancy.
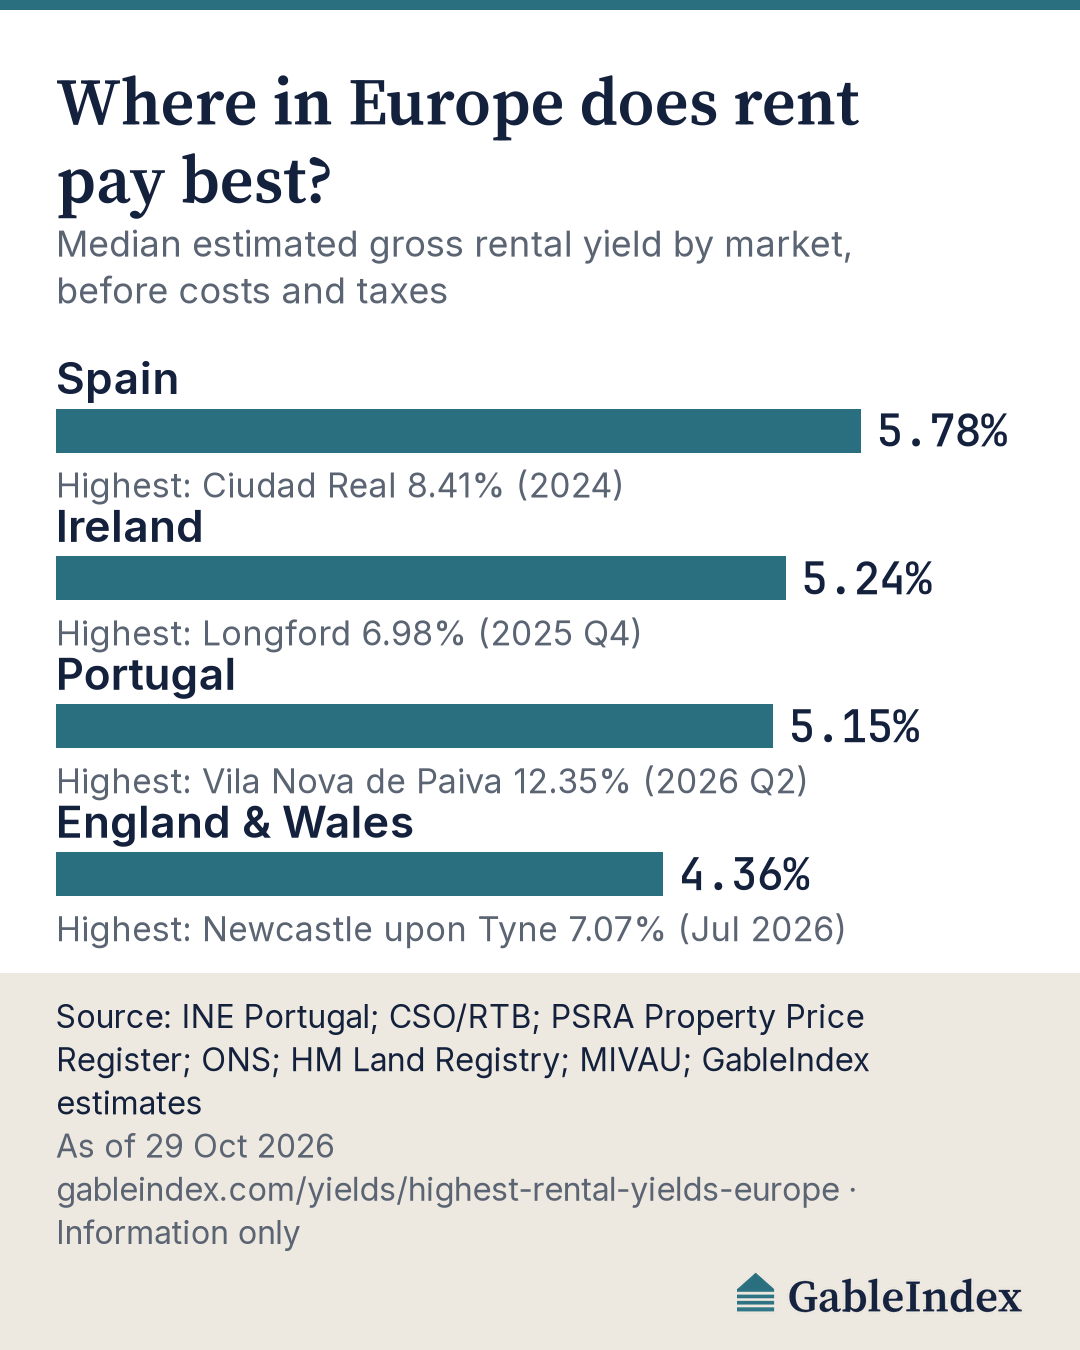
Median yield by market
| Market | Areas | Median est. gross yield | Highest | Lowest | Data period |
|---|---|---|---|---|---|
| Spain | 52 provinces | 5.78% | Ciudad Real (8.41%) | Balearic Islands (3.64%) | rents and prices 2024 |
| Ireland | 26 counties | 5.24% | Longford (6.98%) | Kilkenny (4.49%) | rents and prices 2025 Q4 |
| Portugal | 251 municipalities | 5.15% | Vila Nova de Paiva (12.35%) | Aljezur (3.34%) | rents and prices 2026 Q2 |
| England & Wales | 316 local authorities | 4.36% | Newcastle upon Tyne (7.07%) | Powys (2.99%) | rents Jul 2026, prices 2025-08 to 2026-07 |
Top 25 areas
| # | Area | Market | Est. gross yield |
|---|---|---|---|
| 1 | Vila Nova de Paiva | Portugal (municipality) | 12.35% |
| 2 | Mação | Portugal (municipality) | 12.03% |
| 3 | Vouzela | Portugal (municipality) | 11.90% |
| 4 | Penalva do Castelo | Portugal (municipality) | 11.45% |
| 5 | São João da Pesqueira | Portugal (municipality) | 11.24% |
| 6 | Pedrógão Grande | Portugal (municipality) | 10.75% |
| 7 | Manteigas | Portugal (municipality) | 10.74% |
| 8 | Idanha-a-Nova | Portugal (municipality) | 10.47% |
| 9 | Vila Velha de Ródão | Portugal (municipality) | 10.34% |
| 10 | Aguiar da Beira | Portugal (municipality) | 10.17% |
| 11 | Miranda do Corvo | Portugal (municipality) | 10.11% |
| 12 | Mogadouro | Portugal (municipality) | 9.79% |
| 13 | Sabugal | Portugal (municipality) | 9.47% |
| 14 | Miranda do Douro | Portugal (municipality) | 9.23% |
| 15 | Aljustrel | Portugal (municipality) | 9.06% |
| 16 | Penacova | Portugal (municipality) | 8.96% |
| 17 | Belmonte | Portugal (municipality) | 8.96% |
| 18 | Mêda | Portugal (municipality) | 8.71% |
| 19 | Alijó | Portugal (municipality) | 8.49% |
| 20 | Ciudad Real | Spain (province) | 8.41% |
| 21 | Castanheira de Pêra | Portugal (municipality) | 8.40% |
| 22 | Torre de Moncorvo | Portugal (municipality) | 8.38% |
| 23 | Penela | Portugal (municipality) | 8.36% |
| 24 | Tondela | Portugal (municipality) | 8.34% |
| 25 | Pinhel | Portugal (municipality) | 8.30% |
Get the free Europe rental yields 2026 spreadsheet, plus new house-price and yield figures every Thursday.
We'll only use your email to send the newsletter. Unsubscribe at any time.
Highest in each market
Portugal: highest municipalities
- Vila Nova de Paiva: 12.35%
- Mação: 12.03%
- Vouzela: 11.90%
- Penalva do Castelo: 11.45%
- São João da Pesqueira: 11.24%
All 251 municipalities in Portugal
Ireland: highest counties
- Longford: 6.98%
- Limerick: 6.51%
- Roscommon: 6.22%
- Donegal: 6.01%
- Leitrim: 5.93%
England & Wales: highest local authorities
- Newcastle upon Tyne: 7.07%
- Bristol, City of: 6.41%
- Portsmouth: 6.31%
- Manchester: 6.30%
- Tower Hamlets: 6.25%
All 316 local authorities in England & Wales
Spain: highest provinces
- Ciudad Real: 8.41%
- Cuenca: 8.02%
- Soria: 7.58%
- Toledo: 7.51%
- Palencia: 6.98%
How to read the ranking
Each market uses its own official rent and price series, so the figures are close but not like-for-like: Portugal and Spain divide rent per m² by price per m²; Ireland and England & Wales divide rent per dwelling by the median sale price. Spain uses appraised values and all declared leases; data periods differ by market (Portugal: rents and prices 2026 Q2; Ireland: rents and prices 2025 Q4; England & Wales: rents Jul 2026, prices 2025-08 to 2026-07; Spain: rents and prices 2024). Small Portuguese municipalities rest on few sales and leases and can move several points between quarters. France is covered separately, by department, and is not part of this ranking (France rental yields).
Portugal: INE median rent of new leases (€/m², last 12 months) × 12 ÷ INE median sale price (€/m², last 12 months), same municipality and same quarter.
Ireland: RTB average monthly rent for new tenancies (CSO table RIQ02) × 12 ÷ Property Price Register median market sale price in the same county and quarter; at least 30 sales.
England & Wales: ONS average monthly private rent per dwelling × 12 ÷ HM Land Registry median price paid (standard residential sales, category A) over the 12 months ending in the rent month, same local authority; at least 30 sales. Uses the latest complete Land Registry month.
Spain: Median monthly rent per m² of apartments let as a main home, from tax returns (Spain's housing ministry rent reference system, SERPAVI) × 12 ÷ the average of the four quarterly mean appraised values per m² of free-market homes (housing ministry, valuation statistics) in the same province and year. Rents cover all declared leases, not only new ones; appraised values are bank valuations, not sale prices. The Basque Country and Navarre are included because SERPAVI covers them in this edition.
Questions and answers
Where are the highest rental yields in Europe?
In the 645 areas we cover, the highest estimated gross yield is 12.35% in Vila Nova de Paiva (Portugal). Highest by market: Portugal: Vila Nova de Paiva 12.35%; Ireland: Longford 6.98%; England & Wales: Newcastle upon Tyne 7.07%; Spain: Ciudad Real 8.41%.
Which market has the highest median rental yield?
By median across its areas: Spain 5.78%; Ireland 5.24%; Portugal 5.15%; England & Wales 4.36%.
How is the gross rental yield calculated?
Annual rent (monthly rent × 12) divided by the price, for the same area, from official statistics. It is a gross figure: before costs, taxes, vacancies and financing.
Can I download the data?
Yes. The Europe rental yields 2026 spreadsheet has all 645 areas with sources and periods, free.
Estimate, not an offer or a forecast. Gross yields are before costs, taxes, vacancies and financing, and rents and prices come from different sources and samples. Areas are averages: a specific property can differ a lot. Information only, not a recommendation.
All estimated rental yields · Methodology
Source: Ministerio de Vivienda y Agenda Urbana, Valor tasado de la vivienda (datos.gob.es, CC BY 4.0). Modified by GableIndex (estimated gross yield). Source: Property Services Regulatory Authority, Residential Property Price Register (propertypriceregister.ie). Contains HM Land Registry data © Crown copyright and database right 2021. This data is licensed under the Open Government Licence v3.0. Source: Central Statistics Office (CSO), RTB Average Monthly Rent Report, table RIQ02, licensed under CC BY 4.0. Modified by GableIndex (estimated gross yield). Origen de los datos: Ministerio de Vivienda y Agenda Urbana (SERPAVI, database 2011–2024, last updated Jul 9, 2026). Modified by GableIndex (estimated gross yield). Source: Office for National Statistics licensed under the Open Government Licence v.3.0. Modified by GableIndex (estimated gross yield). Source: Instituto Nacional de Estatística – Portugal (Statistics Portugal), indicators 0014696 (median rent €/m², new leases, last 12 months) and 0012234 (median sale price €/m², last 12 months); reference period as shown. Modified by GableIndex (estimated gross yield).